As the name suggests the Cause and Effect diagrams serve as the cause analysis method. It illustrates a specific effect/problem and all of the possible causes related to it. This type of diagram is used for tracking the exact variable influencing the effect/problem that we need a solution for.
What do you need to create a cause and effect diagram?
- Knowledge of the effect/problem you will be describing;
- Knowledge of the factors influencing the effect/problem;
-
MyDraw for Windows or Mac.
Create a Cause and Effect diagram step by step
Step 1: Identify the Effect / Problem you aim to find a solution for
The beginning of the cause and effect starts with the effect you are looking to achieve or the problem you want to resolve. Perhaps you are looking to increase your sales, or you want to see what is the reason for the increase of your website's bounce rate - you first need to tightly specify what exactly will your
cause and effect diagram be about.

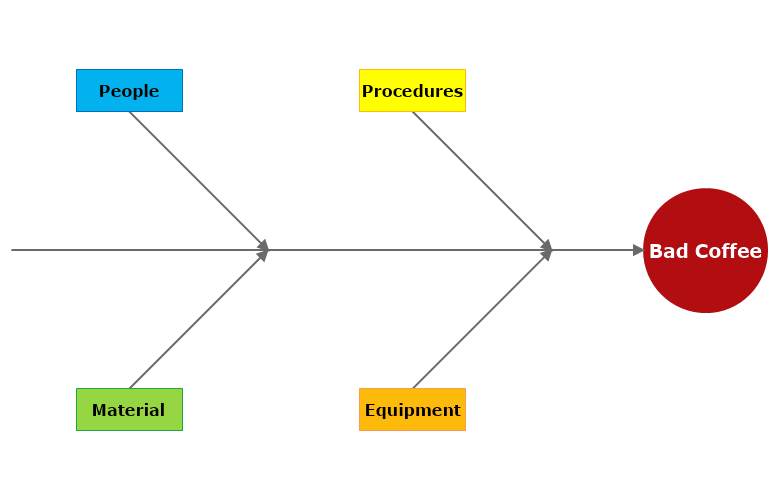
Step 2: Continue by noting the main categories of variables influencing the effect
Once we have the beginning of the cause and effect diagram, the next step would be to draw the "backbone". The so-called backbone is a line with an arrow pointing toward the effect and representing the direction of the cause-effect relations within the diagram. Then we need to specify each of the main variable categories that might influence the effect and connect them via an arrow to the backbone.
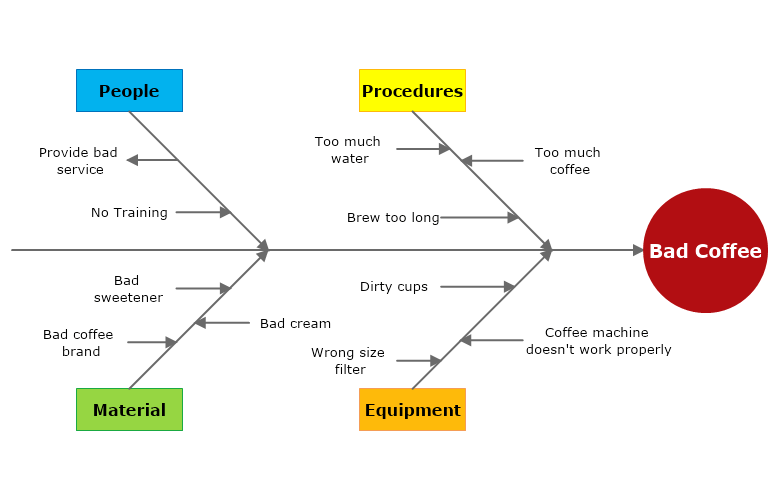
Step 3: List every unit within each category of causes that might be related to the result of the effect
From this stage and on all we have left is to list all the possible units within each category. To have a full vision and understanding of the effect it is important to note every little detail that might cause a change to it.