Diagram Types

Diagrams

Diagrams are visual symbolic representations of information. They are a plan, sketch, drawing, or outline design that demonstrates how something works or the relationships between the parts of a whole. They are an abstract representation of visible or invisible entities and the relations between them, that aims to provide wider and organized information which cannot be observed in another way.

Diagrams are divided into numerous types based on a different kind of information that needs to be visually illustrated.

Some of the main diagram types are:

Business Process Model and Notation Diagram

BPMN Diagram

BPMN is used for providing a standard graphical representation of business processes that are easy to understand for both technical and business users.
Brochure

Brochure

Brochures are a type of promotional material (document) that can be folded into a template. They are primarily used to introduce a company, a product, or a service and inform prospective customers or members of the public.
Business Cards

Business card

Business cards are one of the most important accessories of the modern person. With their compact size and ability to contain all the necessary contact information of the cardholder – they are the best tool when networking or in any business environment.
Manufactury industry fishbone diagram

Cause and Effect Diagram

Cause and Effect diagrams, also known as Fishbone or Ishikawa diagrams, are one of the best problem-solving tools in existence. With everything being so complex in the business world nowadays, cause and effect diagrams can be extremely helpful, as they provide the full spectrum of all possible aspects that might be causing an issue.
Certificates

Certificate

Certificates are a form of an official document that serves a variety of purposes. They can be used as proof of professional qualification, birth information, marital status, or simply as a sign of individual or group recognitions.
Circuit diagram

Circuit Diagram

Circuit Diagrams are used for representing all different kinds of circuit electrical systems. They use characteristic shapes and icons, each assigned to a specific part or process within the electrical system.
Cross functional diagram

Cross-Functional Flowchart

The Cross-Functional Flowchart is a type of flowchart that diagrams a process from beginning until the end, while it also assigns each task from this process to a category and helps distinguish which employee or department is responsible for completing it.
Data Flow Diagram

Data Flow Diagram

Data Flow Diagrams are used to provide a clear representation of any business function and the information flow running through it. They illustrate the flow of data within informational systems allowing system analysis to collect information necessary to determine information system requirements.
Education Diagram Types

Education Diagrams

Education diagrams can be used to present how conceptual objects are interrelated in a study field. Diagrams are particularly useful to enhance your learning process. By creating an education diagram to summarize and organize complex material, or to brainstorm for a class project. Another way to speed up and excel in your studies is to transform text-based data and information and put them into a visual representation.
Emergency Evacuation Plan

Emergency Evacuation Plan

Evacuation Plan Diagrams are designed to layout the exit routes in a building in case of an emergency. National Fire Protection Association (NFPA) states that the safe evacuation of the habitats of the building depends on the advanced planning procedures, warning signs, and advanced warning for smoke and carbon dioxide alarm. Evacuation Diagrams are an important part of every property’s response plan, providing authorized parties, floor wardens, and staff with a clear picture of the egress routes and life safety equipment available.
EPC diagram

EPC Diagram

EPC diagrams (event-driven process chain diagrams) are a type of flowchart used to visualize, analyze, and optimize (re-design) business processes.
Family tree

Family Tree Diagram

The Family tree diagrams are used to present all members of the extended family. Depending on the need for which the diagram is created, the family tree can contain either basic details about each member, or the complete background information.
Floor plan diagram

Floor Plan Diagram

Floor Plans Diagrams are used to present the distribution of rooms and spaces. The positioning of the walls, doors and windows and the arrangement of furniture and appliances.
Flowcharts

Flowchart Diagram

Flowchart diagrams are used to clearly illustrate processes from beginning to end. Several flowcharting types exist to provide a solution for a variety of requirements.

MyDraw takes you through each flowcharting type in detail and with plenty of ready-made templates to choose from.
Demo Flyer

Flyer

Flyers are a form of paper advertising, usually of an event, a product, or a promotion. They are one of the easiest and most cost-effective ways of promotion - the main method behind the concept of disposable marketing.
Genogram Sample

Genogram

A genogram is a pictorial display of a person’s family relationship and medical history. The information listed in a genogram goes beyond the one in standard family tree diagrams, as it also provides the user with the knowledge of the hereditary patterns and psychological factors that punctuate the relationships within the person’s genealogy.
Gift Certificate Design

Gift Certificate

Gift Certificates are a great way to add value to your offering or to provide people the opportunity of purchasing presents for their friends and loved ones.
Circulatory System Diagrams

Hierarchy Chart

A Hierarchy Chart (hierarchical diagram) shows the breakdown of a system to its lowest manageable parts.
Infographics

Infographics

Infographics convey a self-contained message or principle. They are visual presentations of information that use the elements of design to display content. Infographics are used to present the collected data or information in a way that is easy to comprehend and reach its target audience. Graphics, have a huge impact in many fields and can contribute to the process of information, communication flow, and compact within a larger audience. The visual presentation can ease the process of developing, organizing, recording, and communicating conceptual information.
Invoices

Invoices

Invoices are used in general to request payment from buyers, keep track of sales and have control of inventory, while facilitating the delivery of goods and services. The invoice has equal value for both the supplier and the receiver of goods. With this type of document, both parties can keep track of their transactions and expenses for some time. This document is very helpful to aid the monthly financial report and evaluation.
Legal Diagram Types

Legal

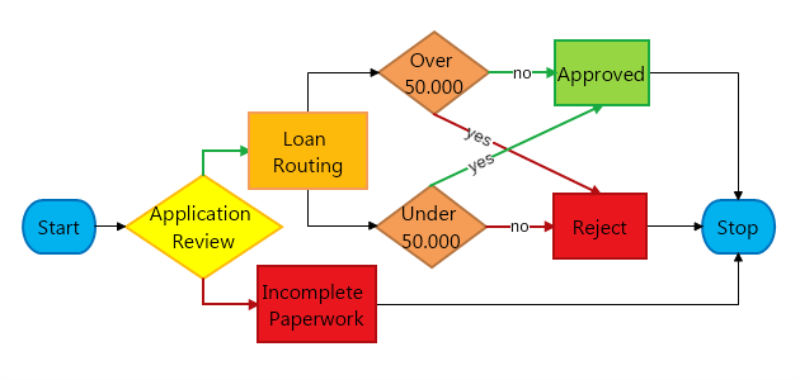
Legal processes can be presented through diagrams to analyze legal processes and topics, identify various case scenarios, and suggest a different point of view. These legal templates can be used in resolving a crime scene, documenting reports thoroughly (improve reporting), reconstructing a road map accident, etc. To resolve your legal process, except a professional in the field, you will need powerful diagramming software. MyDraw is an advanced diagramming software in which you can create a diagram, arrange a table, layout and edit a ready-made template, or design one from scratch.
Menus

Menus

Designing a menu for a restaurant, bar, or a coffee house doesn't need to be hard - MyDraw offers the perfect functionality and some useful templates for inspiration.
Mind Map

Mind Map

Mind Maps are used for illustrating the process of systematic thinking and mental schemas. They visually represent information such as ideas, tasks, or goals, through connected keywords. In this way, the user or group can better analyze, comprehend, synthesize, recall and generate new ideas. They are used as a simplified content management system (CMS), that allows you to store all your data in a centralized location to stay organized.
Network diagram

Network Diagram

Network diagrams are used to visualize the nodes and connections within the computer or telecommunications networks.
Newsletters

Newsletters

Newsletters are a great way to keep your customers engaged with everything happening in your business. MyDraw provides a quick and easy way to design fantastic newsletters without any background in graphic design.
Organizational chart

Organizational Chart

Organizational charts also called organigrams and ORG charts, are used for presenting organizational structures and the connections between the different participants in them.
Scientific

Scientific

Scientists use inscriptions, such as tables, graphs, and illustrations to provide readers with a visual representation of data. Scientific diagrams are designed to be simple, clear representations of scientific equipment and experiments. They need to convey information in a way that can be easily interpreted by others.
Scorecards

Scorecards

The Scorecard has been one of the world’s top management frameworks since its introduction in the early 1990s. The purpose of the scorecard is to help managers make better allocation and prioritizing decisions, enabling them to see exactly which initiatives are necessary to meet the organizational goals. By using a table format and visual representation the data is easily processed by its intended target. However, as it has a compatible structure, the scorecard is used in a different type of occasions: to measure performance and provide feedback, for project development, track record or in sports games, etc.
Sdl diagram

SDL Diagram

SDL diagrams are used to model and visualize the processes of the state machines for the systems of communication, telecommunication, automotive, aviation and medical industries. SDL (Specification and Description Language) is a specification language for creating specifications, descriptions of the behavior, data, and inheritance for real-time systems.
Seating chart

Seating Chart Diagram

Seating Charts have widespread use in many industries. They can be equally good for preparing a hall for a large event, organizing an official gala dinner, planning a wedding, or simply calculating the number of chairs and desks you need for the company business conference.
Timeline

Timeline

Timeline diagrams present events during specific intervals shown chronologically along a line. These events may be historic, related to a specific case or business development, or they may be important milestones in a project. For your business, timelines are designed to provide a broad overview of a sequence of events in time.
Venn diagram

Venn Diagram

Venn diagrams are amongst the most popular types of diagrams used nowadays. They serve multiple purposes including comparing two or more items; visualizing similarities and differences; presenting the results of combining two or more items, etc.
Workflow diagram

Workflow Diagram

Workflow diagrams help visualize a work process, thus allowing for better understanding when looking for an issue or redesigning a process to ensure better productivity. Workflow diagrams have widespread use across industries and departments, including manufacturing, software design, customer service, and even government organizations.