The basic concept of the Cause and Effect diagram was first used back in the 1920s as a method for product quality control. The fishbone diagram is, however, officially created almost half a century later (1968) by Kaoru Ishikawa to serve as quality management procedure control in Kawasaki. The Cause and Effect diagram can also be found under the name – Ishikawa diagram, named after its official creator, or as Fishbone diagram - based on its fishbone-like looking structure.
What are Cause and Effect diagrams used for?
As the name suggests, this type of diagrams is used to describe an effect and the conditions that cause it. The Fishbone diagram is the initial step in the screening process when trying to find a solution to a problem. It helps us begin by defining the problem and noting it down. Then draw the “backbone of the fish” to which we attach all main categories related to the issue. In the end, we assign all possible aspects of each category that might have gone wrong and caused the problem. Once we have the diagram ready, we can easily see the whole picture and track down the possible issues.
Types of Cause and Effect diagrams
Fishbone diagrams are used for monitoring the quality and services across industries. Generally, we can categorize all industries in 3 major groups - services, manufacturing and management (marketing/business management). Each of those groups has several categories that influence its results.
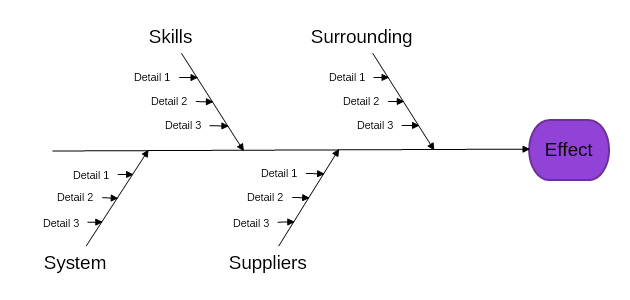
1. Within the service industry we can talk about the 4 S's:
- Surrounding – meaning the market needs, requests, and the competition.
- Suppliers – the organizations delivering supplies and their characteristics.
- System – the methods used for providing the service.
- Skills – the qualifications of the employees and co-workers in the organization.
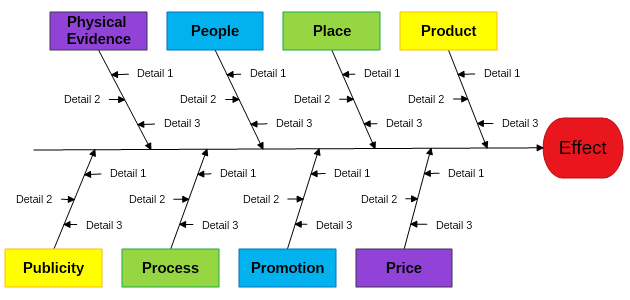
2. Within the management industry we can talk about the 8Ps:
- Product – referring to all aspects of the product or service offered by the organization.
- Price – the price range of the kind of product/service the company provides.
- Place – the distribution of your product and the location of the working place.
- Promotion – the strategies used for gaining new customers and involving the ones, that the organization already has.
- People/personnel – as it is no secret, the employees of a company can make it "fly or die", based on their qualifications and motivation to work.
- Process – the procedures used for completing the work/service.
- Physical Evidence – everything visible that can be directly related to the provided product or service.
- Publicity - all the information about the provided product or service and the method used for presenting it to the company’s target customers.
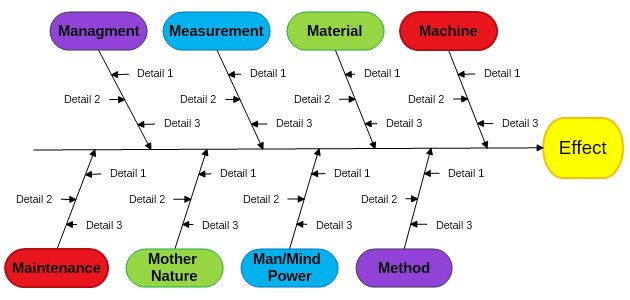
3. Within the manufacturing industry we can talk about 8 M's:
- Machine – the technology and machines used for production.
- Method – the processes used by the company.
- Material – it applies to everything needed for manufacturing the company’s products.
- Man/Mindpower – the working force of the organization.
- Measurement – the technicians used for planning the manufacturing processes, and for monitoring the same.
- Mother Nature – all the parameters of the environment that can affect the production.
- Management – the way the production is handled and finances are managed, according to the manufacturing needs.
- Maintenance – referring to keeping up the production line in the necessary working conditions, as well as to the support and warranties provided to customers.