What is an Infographic?
An infographic (information graphic) is a representation of information in a graphic format designed to make the data easily understandable at a glance.
Infographics serve various fields so that the data or knowledge can reach its intended audience quickly and clearly. They can improve cognition by utilizing graphics to enhance the human visual system's ability to see patterns and trends.
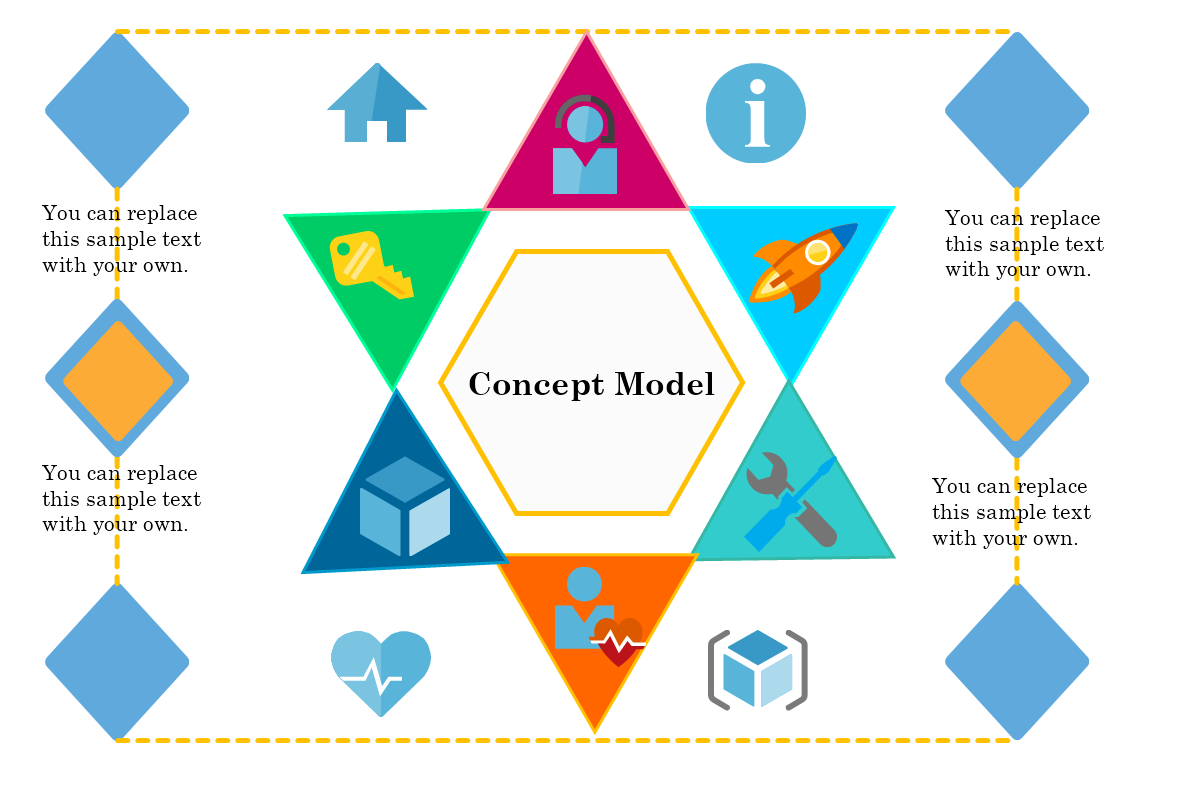
In MyDraw you can explore a wide selection of icons, infographic symbols, and elements to help you create the perfect Infographic for your project requirements.
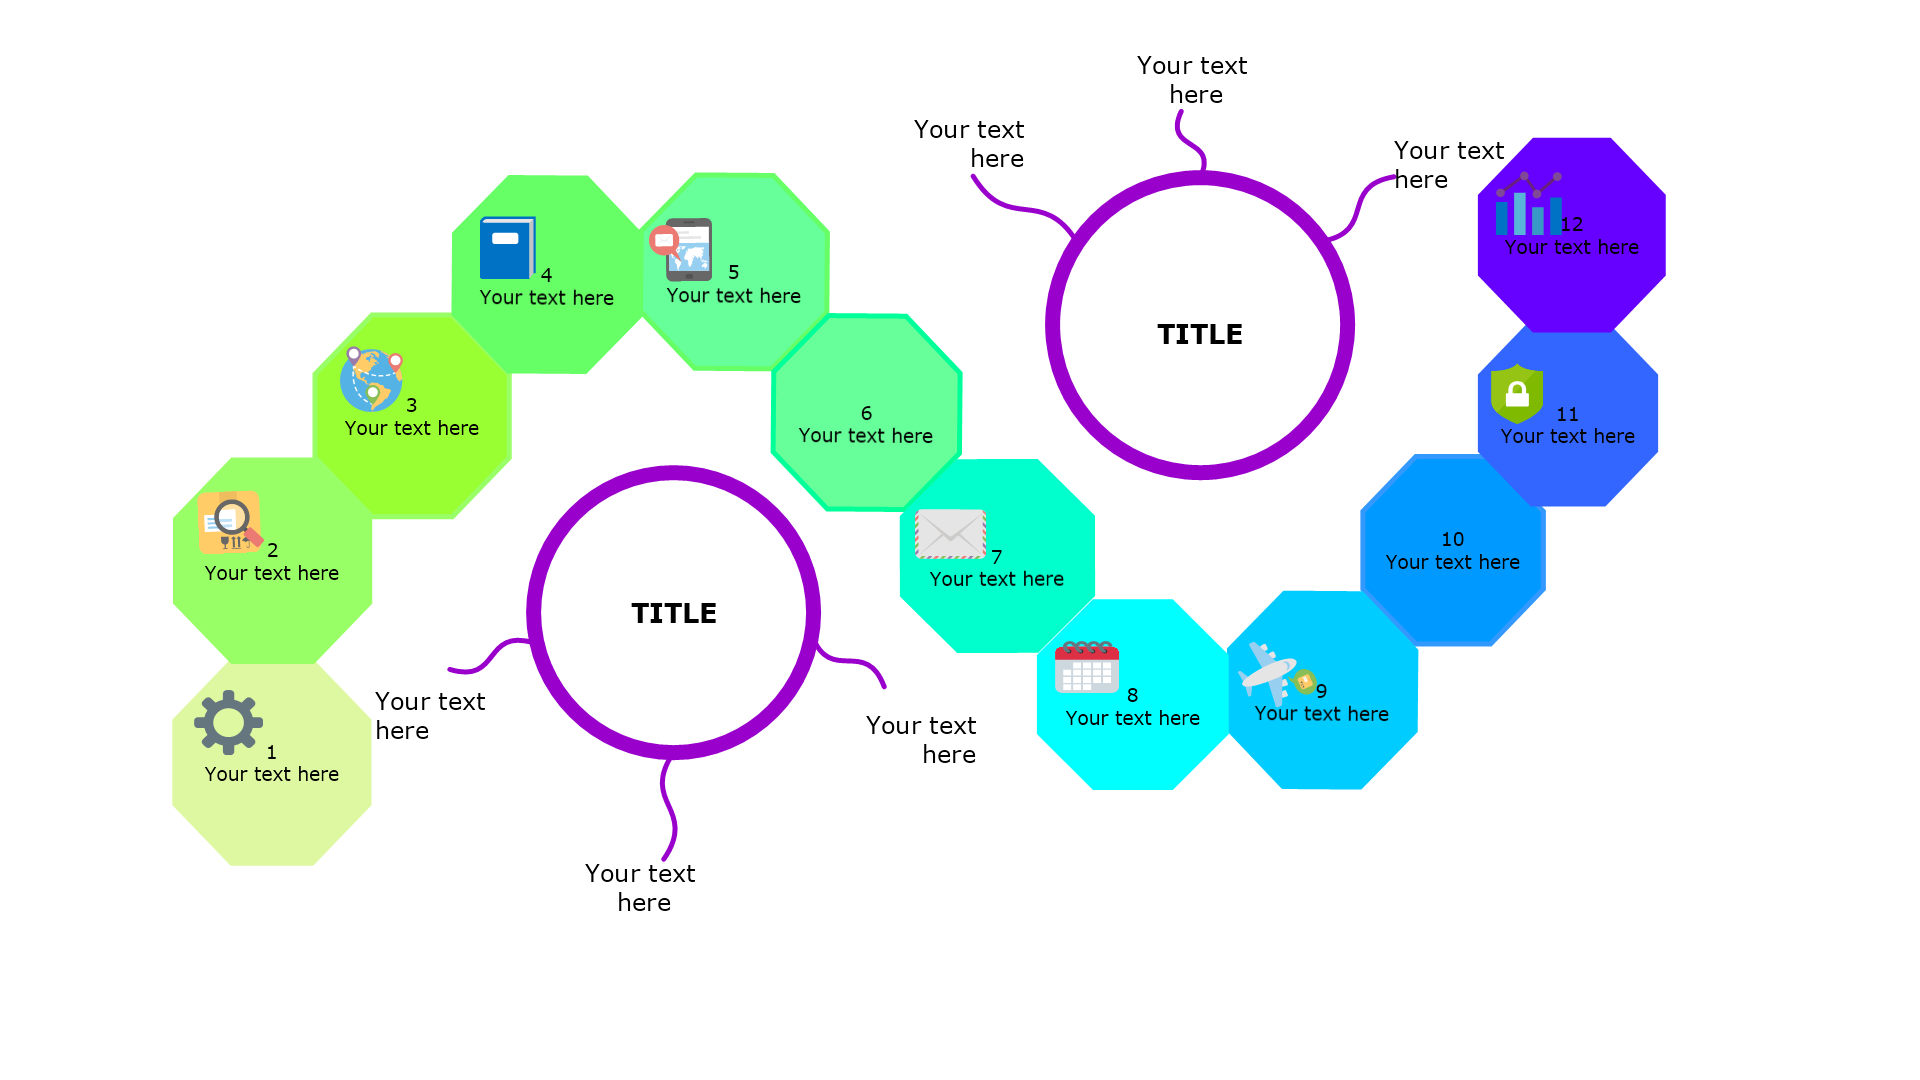
Those infographic shapes serve various functions, such as organizing information, explaining a complex process or grouping data. Here are some of the most commonly used symbols:
For a more comprehensive list, see our full Infographics shapes library.
What are Infographics used for?
Nowadays the term “infographic” has become the broadest descriptor of a specific type of visual communication that includes graphics showing data, copy, or both. In general, they are used by professionals and non-professionals, for business or personal needs to capture the attention and enhance comprehension.
Businesses can adopt Infographics for:
- Viral marketing campaigns and email marketing.
- Content marketing strategy.
- Comparison analysis.
- Data and reporting.
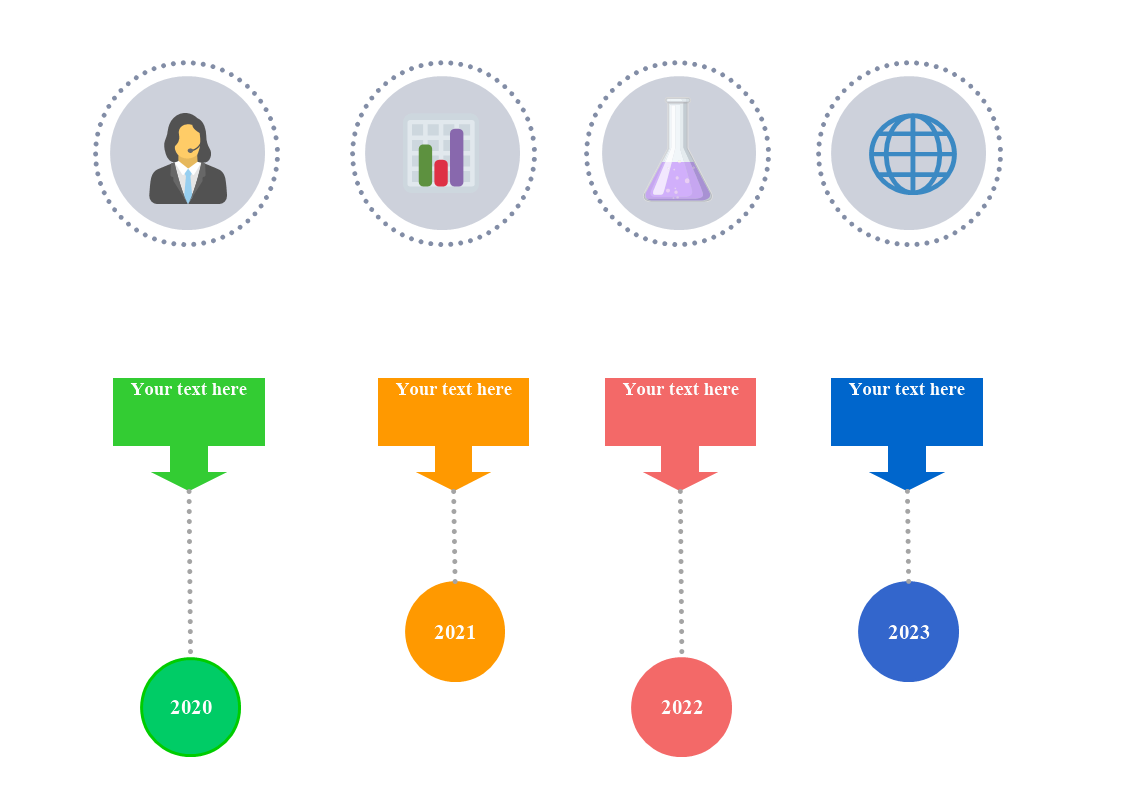
- Scheduling and project development.
- Product launch and company deadlines.
- Editorial coverage and press releases.
- Creating quarterly or annual reports for executives or investors.
- Outlining different options for business operations improvement.
- Highlighting the company’s different products and services.
- Training new employees with complex written manuals.
- Business process and employee feedback.
These are only a few examples of the many uses of infographic diagrams. Drawn on hand in the past, today's information graphics are mostly created with diagramming software such as MyDraw. To find the perfect template for your project requirements click here.
4 key purposes of an Infographic:
- Displaying survey data
- Simplifying a complicated concept
- Comparisons
- To raise awareness
Types of Infographic
Infographics display large amounts of data and information in the form of a graph or picture. They are used for many reasons. They are entertaining, eye-catching, concise, and all the information they contain is easily digested by the reader.
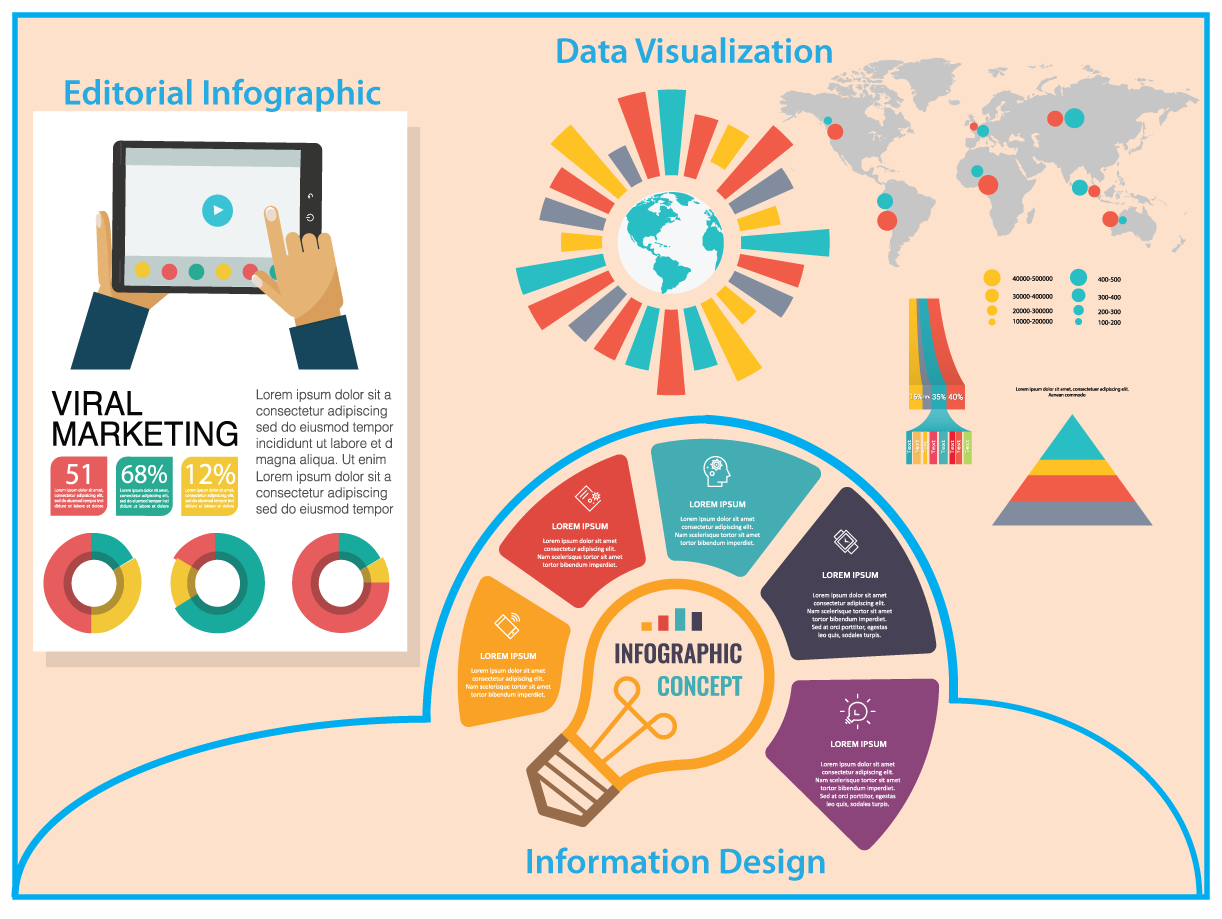
These graphs can be grouped into the following categories:
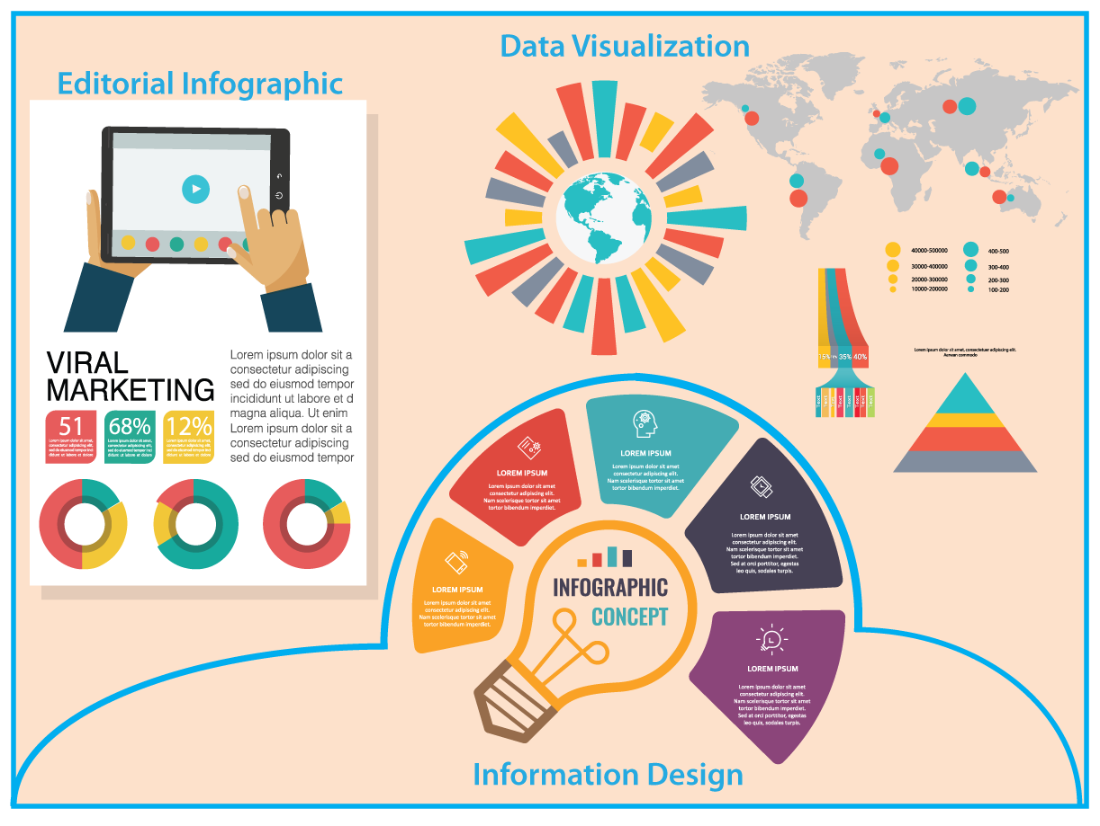
- Data visualization – Data visualization translates that data into a visual language that can be easily and instantly understood by a wide group of people in the form of graphs, bars, pie charts, and charts.
- Information design- A graphic design that focuses on the display of information efficiently and effectively. It is not made from specific data points but rather concepts or other information, such as process, anatomy, chronology, or hierarchy. Most commonly it is presented with different types of diagrams, such as flowcharts, organizational diagrams, or timelines.
- Editorial infographics- A graphic content used by editorials to replace the traditional non-visual presentation. Their usability by publications has increased during the years, due to social media and to engage readers.
Each type has its purpose and can be a powerful storytelling and marketing tool.
- Visual representation of facts, events or numbers.
- Reflects a pattern; storytelling.
- Tells a premeditated story with a set conclusion.
- Subjective – guide the audience to a particular conclusion.
- Used for marketing content, blog posts, case studies.
- Visual representation of data.
- Data is presented in a schematic form, highlighting the purpose.
- The collected data are facts, with no agenda.
- Objective – analyzing the data; users draw their conclusions from the data set.
- Used for reports and editorials, statistics.
How to Make an Infographic in MyDraw?
MyDraw includes a wide selection of templates to get your started, even if you are not a professional designer. However, with MyDraw’s shapes library, you can also create your own with a few drag and drops.
- Choose your topic and define your audience.
- Determine your Infographic orientation and Visual Hierarchy.
- Gather your data and tell a story.
- Set your goals and how to visually represent the information.
-
Open a “Blank drawing” template in MyDraw.
-
Make sure that you opened the Basic Shapes and Clipart Library. The Basic Shapes will help you arrange the structure of your graphic. Based on your topic you can choose from a variety of shapes from the Clipart library.
-
To make modifications to your connectors you can right-click on the page and select Shapes Properites>Geometry and click “Ok” to apply the changes.
-
To add fill and stroke to your shape you can right-click on the shape and choose “Format Geometry>Geometry Fill/Stroke/Shadow”. To make changes to your typography you can select “Format Text Block”.
-
In the Ribbon, you have a selection of tools and style editors: connectors, paragraph alignment, text, and shape styles.
-
Navigate to the ribbon and from the Design Tab, you can apply a design theme to your Infographic.
-
Once you are finished choose a file format to save your Infographic from File>Save or File>Export.
Different Design Styles
An effective design style delivers the company’s data in a way that helps the audience understand the information easily. The design drives value creation for businesses. It enables them to differentiate their products from competitors and create a customer experience.
Benefits of Infographics
- Audiences are more visually literate. People remember 80% of what they see - only 20 percent of what they read.
- Technology has improved.
- A desire for objective data.
- Brands have embraced design-centric thinking.
- SEO/Traffic
- Engagement and Shareability.
- Simplifies communication and clarifies messaging.
Tips and Tricks
- Determine the best visualization that will get your point across.
- 90% of the information that the human brain processes are visual.
- Infographics get the point across. They are the most sharable content on social media.
- Increased engagement leads to conversion and a longer time on your website.
- Format and size are crucial for the use of the company’s infographic for marketing. The ideal size is 600x1800px.
- Brand identity is strengthened by the use of branded colors.
- Simple, easy, and clear messaging.