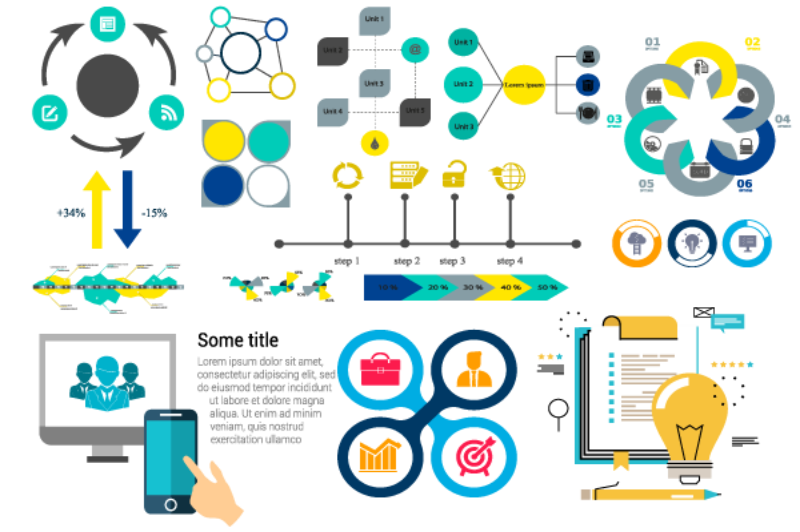
Infographics have emerged as one of the most creative and effective digital marketing tools for increasing customer engagement. Their purpose is to convey necessary information to the target audience by presenting complex information more simply.
- Define the goals and objectives then pinpoint your target audience.
- Choose a relevant topic.
- Collect data and information; check your resources.
- Decide how to visualize the data and set the tone of your infographic.
-
MyDraw for Windows or Mac.
Creating compelling Infographic step by step
Step 1: Information Gathering- Collect as much information and data as possible and decide which content is relevant or should be used/converted into an infographic.

Step 2: Visualize data- Well-designed infographics must tell a story, where one fact or data point is connected to the next. The best way to create it is to profile your learner( age, work, interests, etc.). Tell the story of how you expect your learner to read through the Infographic. This will give you an idea of how to place the content(orientation, flow, placement, diagram, graphs, charts, icons, etc.).

Suggestions for visuals and data sets:
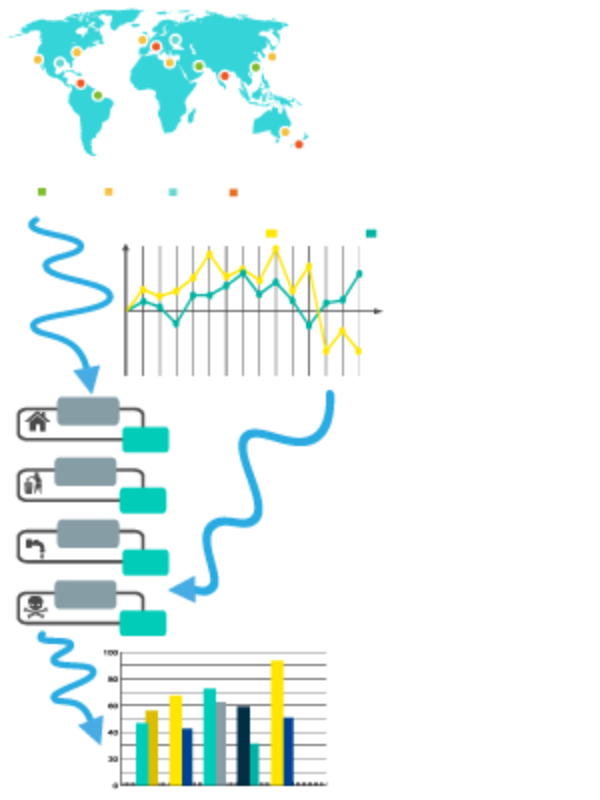
- Map (location, schematic, spatial)
- Graph (quantitative data, comparison, the relationship between quantities)
- Diagram (icon, sequence, process, timelines)
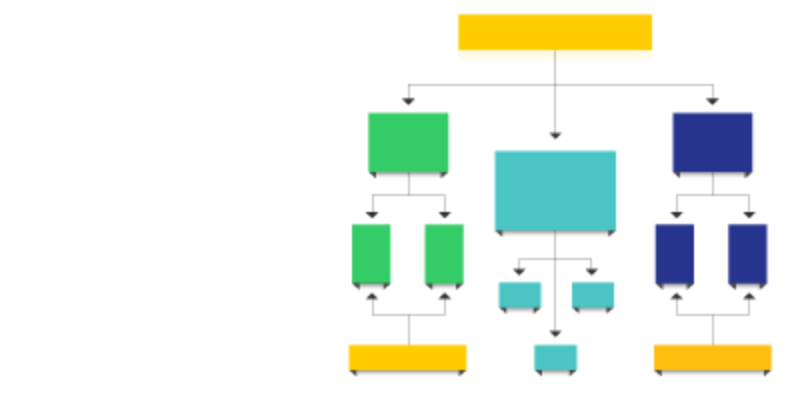
- Chart (flow, organizational, schematic)
Step 3: Outline- Develop an idea hierarchy. The purpose of the data flow is to highlight:
- The headings and subsections of the Infographic.
- The connection between elements.
- The prioritized information ( the emphasis should be on the key points.).
Step 4: Wireframe- Create the frame of your Infographic.
Step 5: Design and refine-Add contrast, color, and typography to the frame.
-
Visual Elements
- Color
- Graphics
- Reference icons
-
Content Elements
- Time Frames
- Statistics
- References
-
Knowledge Elements
The Principles of Infographic design
- Write a great headline-A good title will catch the attention of the audience and encourage them to read more.
- Create a logical flow-The argument has to flow visually and logically. An advantage of the infographic design is that it logically presents a flow of ideas and data in a visual format.
- Focus your content-In order not to lose the reader's attention. The main argument must be supported by relevant facts and statistics.
- Target your audience- The design elements should resonate with the target audience.
- Pay attention to length and size- The length and size should be accurate. Keeping your infographic short and concise will improve the reader's engagement and promote social shares.
- Balance text and graphics- An infographic is a combination of text and graphics. The text should be persistent and short to list the relevant fact. The graphics should be eye-catching and straightforward to support the content.
Tips and tricks
Keep It Simple- Infographics are best when they are in simple visual form and easy to understand.
Make It Interactive-Make sure the content you use in your infographic is informative, engaging, and appealing to your viewers.
Use Bright and Attractive Colors- Bright colors make the content more visually appealing and become prominent among other similar Infographics.


