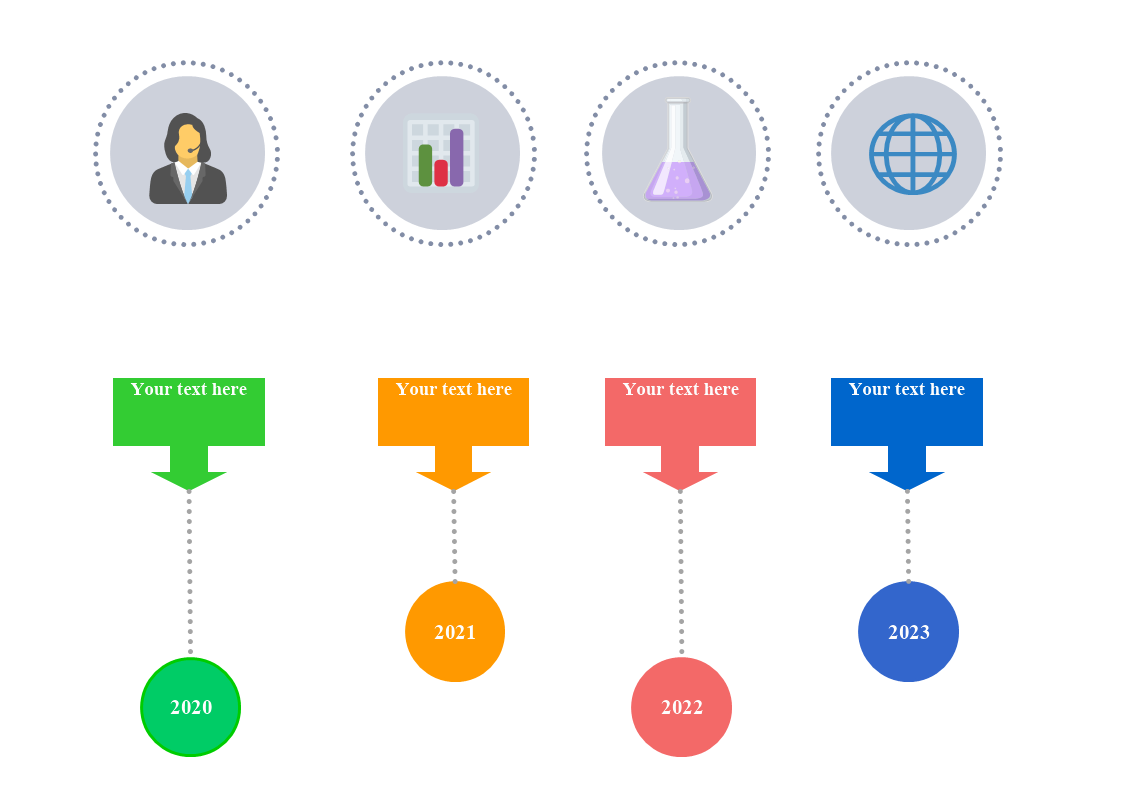
Timeline infographics represent the history of events in chronological order, outline elements and points, highlight important dates and facts.
There are 2 factors to consider when choosing the layout design- the number of points in the outline and the amount of text associated with each point.
The Vertical Timeline infographic layout can be with 2 alignments- centered and left-aligned. The centered vertical layout is best used when there many points with a mixture of text and images. Left-aligned vertical layout is used to present complex information hierarchically or as a series of steps. A Horizontal timeline infographic layout has the best purpose when it comes to presenting a new business idea with a slide-deck timeline to showcase the company’s milestones. The Snake Timeline infographic layout is most efficient when presenting more points of information.
This is a basic Timeline Infographic, which can be customized from the Objects shapes library.