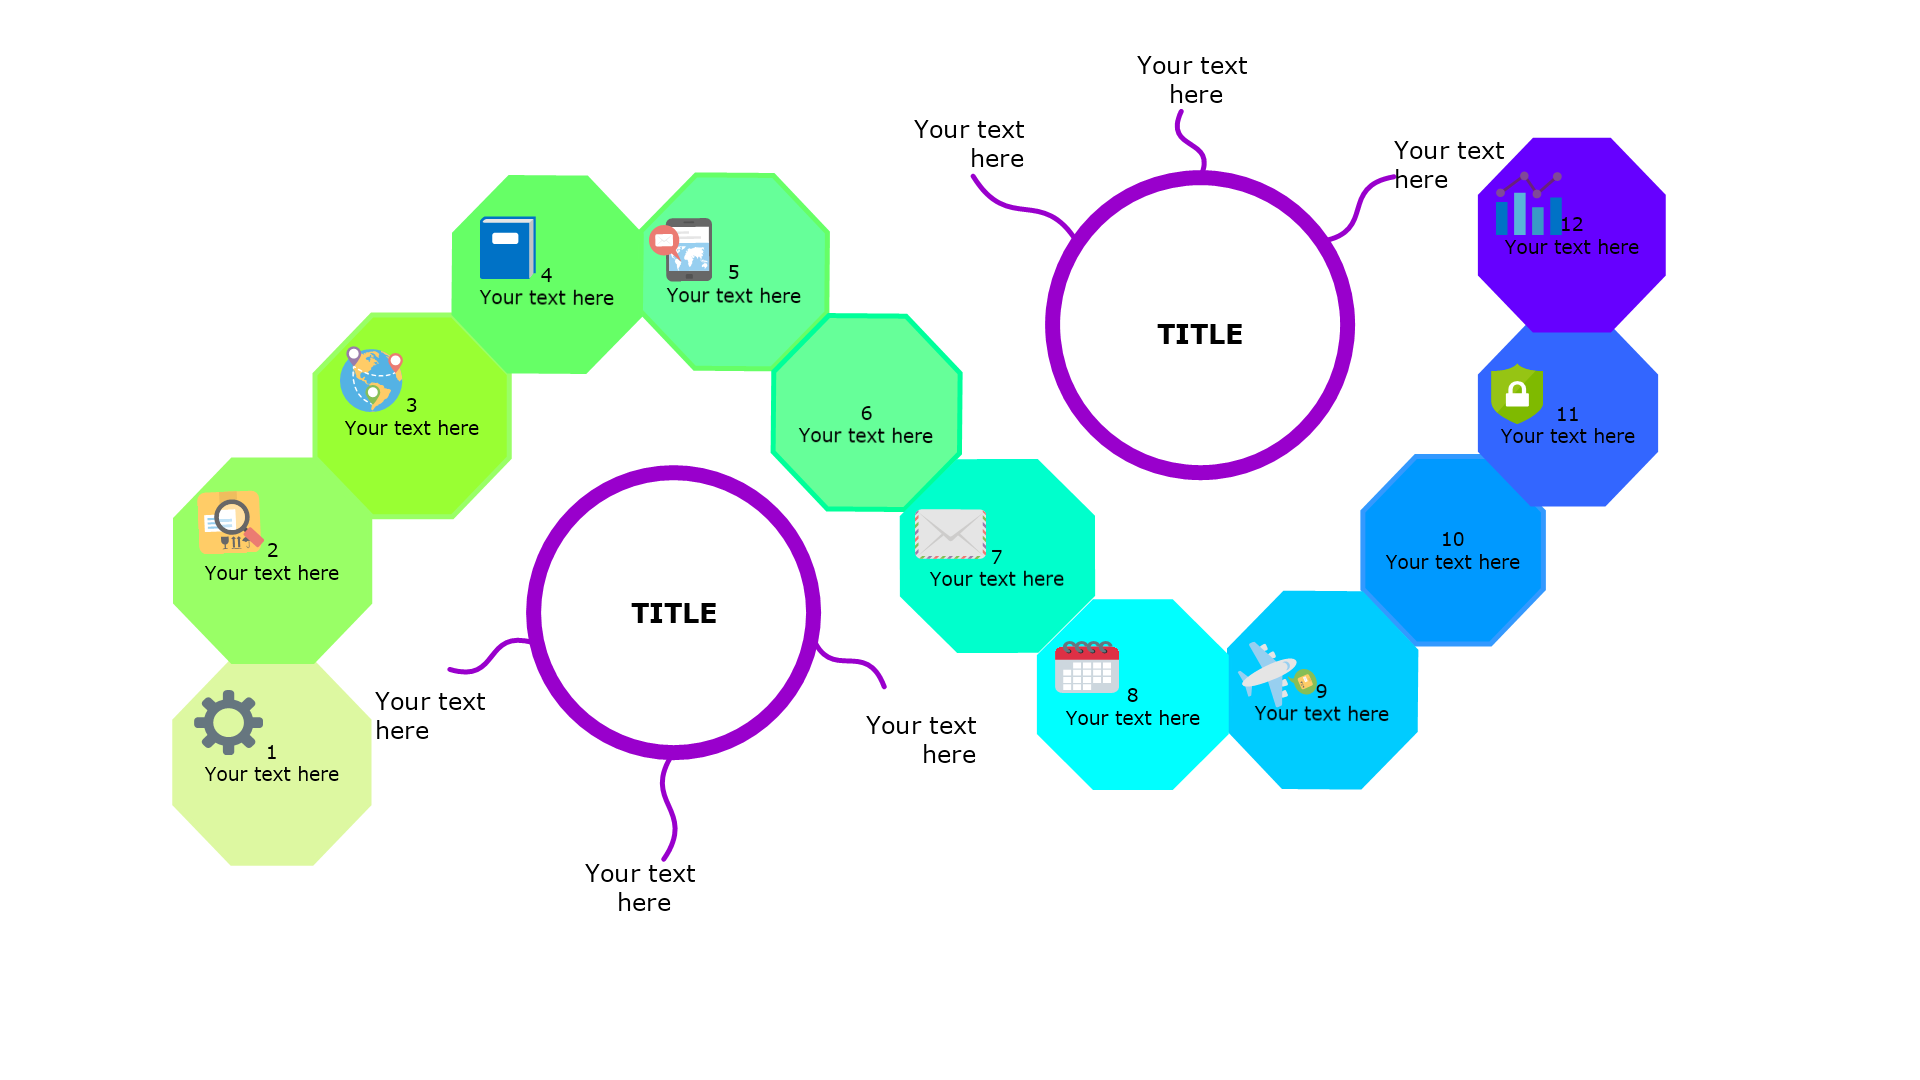
This is a free Wave Chart Infographic template that a company can use to map out key points in chronological order, to project future goals, or to make a plan next steps. The template is a 100% customizable and you can edit every aspect of it with a few simple clicks in MyDraw.
Download Template:


Download Template:
Action plans are an essential part of the strategical planning process and improve teamwork, performance, and task distribution. But what is the best way to minimize the challenges during the growth stage of your company? How to prioritize the main steps and how to avoid the setbacks during the business journey?
SMART criteria
- Specific– well-defined and clear.
- Measurable– include key performance indicators to track progress.
- Attainable– realistic and achievable within the resources, time, money, the experience of the business.
- Relevant– aligned with your other goals.
- Timely– end date.
How-To create your Project Timeline?
- Define the project brief, goals, timeframe, and dependencies.
- Internal and external goals of the project.
- The stakeholders and key milestones.
- Breakdown the main activities to estimate the time needed for each step of the project and build your timeline.
- Prioritize tasks and add deadlines.
- Identify the resources.
- Make it visual.
- Monitor, evaluate, and update.
To sum up, a project timeline tracks the chronological order of events. These timelines give the involved teams and departments a clear view, keeping everyone informed and aligned at every stage of the project.
This is a basic Wave Chart Infographic, which can be customized from the Business shapes library.
