A Hierarchy Chart (hierarchical diagram) shows the breakdown of a system to its lowest manageable parts.
It is a top-down modular design tool, constructed of rectangles (that represents the different modules in a system) and lines that connect them.
The lines explain the connection and/or ownership between the different modules among the system just like in an organizational chart.
Those diagrams are used to present all parts in a system and the way they are arranged in it.
A hierarchy chart starts with the name of the system as a single entity and through a drill-down list all different parts of this entity.
It is used for describing the structure of a whole along with all its parts which are small enough to be understood by a human brain.
What is Hierarchy Charts used for?
As mentioned above their main purpose is to describe the structure and hierarchy of an entity.
This entity could be a strategy, event, software program, and so on.
The hierarchy chart is suitable in any situation that aims to present the organized structure of a material or an abstract entity.
Hierarchy Chart: material entity
This type of diagram is capable of describing any kind of material entity to its smallest meaningful parts and present them in an easy to understand hierarchical view.
This style of the hierarchical chart can be used equally successfully for:
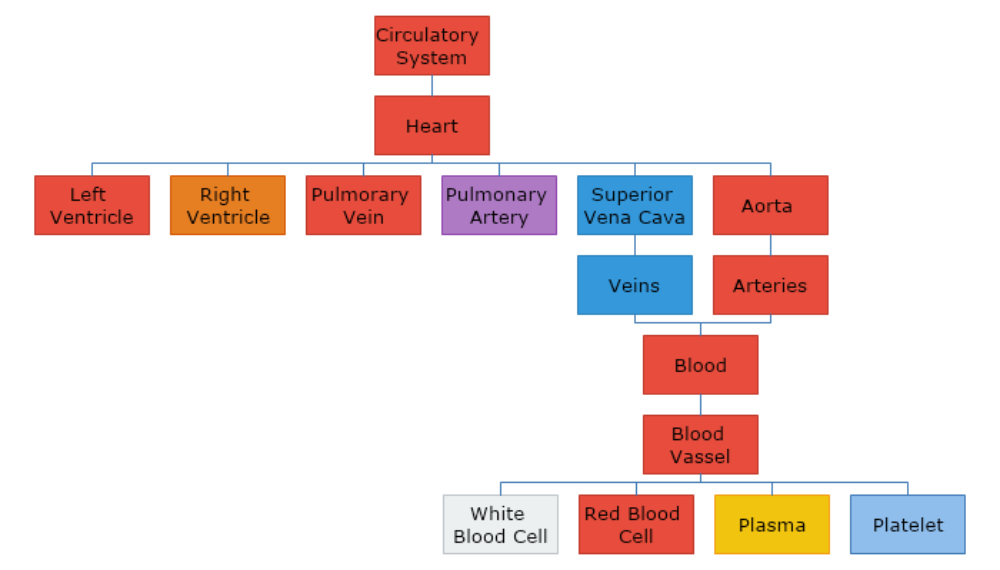
- educational purposes – when aiming to present complicated information in an easy to understand manner.
Example: when teaching biology and trying to explain the circulatory system. - business purposes - when we need to be able to easily observe all the parts of a working system.
Hierarchy Chart: abstract entity
Abstract objects are way harder for understanding as they cannot be observed through any physical receptors.
Nonetheless, there might be some parts related to one another in a large complicated system.
For instance, one’s budget is an abstract entity.
Although we can see, touch, and count the money they have, the budget itself is an abstract whole.
When planning a budget we need to work with the mental representations of all the abstraction that we have in our structure.
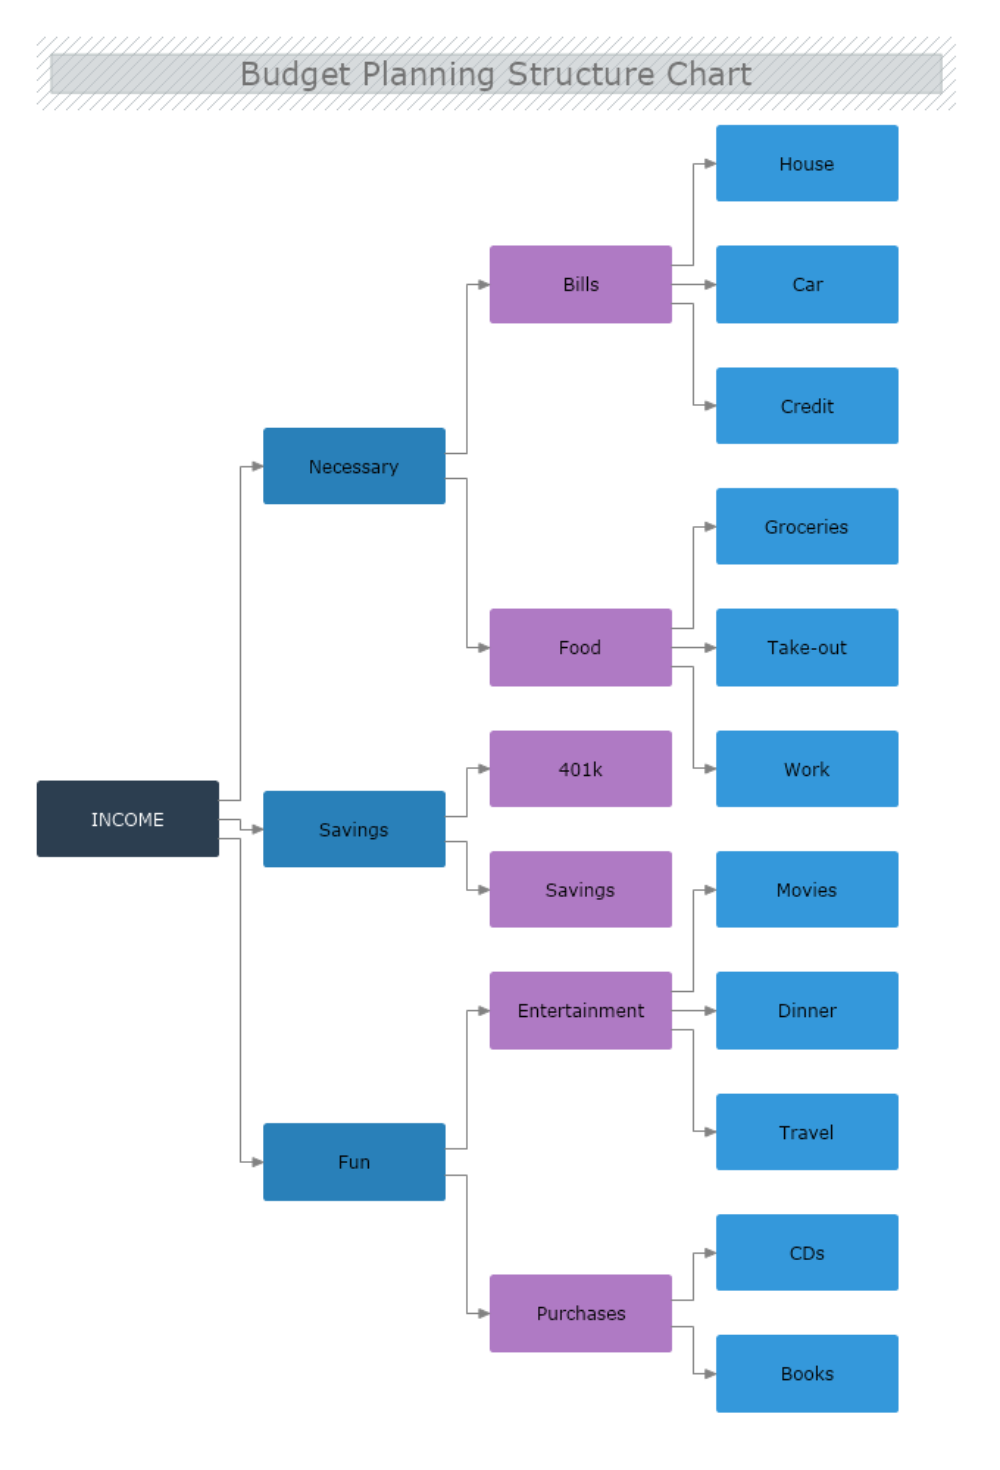
In this sample hierarchy structure chart of Budget Planning shown below, we start from the abstract of Income and via drill-down, we split it to 3 other abstractions:
Necessary, Savings, and Fun. Following up we split all of them to even smaller and easier to understand units until we reach the last hierarchical level.
There we have the smallest categories of units we need for providing a detailed explanation of the whole structure of the budget and the way we would like to distribute the income.